WHEN BUSINESS-IT ALIGNMENT MATTERS
The Business dictionary (businesnessdictionary.com) defines performance as “the accomplishment of a given task measured against preset “known” standards of accuracy, completeness, cost, and speed”. This means performance is deemed to be the fulfillment of an obligation, in a manner that releases the performer from all liabilities under a “contract”.
Performance must have a bearing of taking a look back at what’s being done, as well as enabling steer execution towards set objectives.
Relating this understanding to the Information and Communication Technology sector, the use of “performance” as a measure to continually set technology or technical objectives and benchmarks for improvement is fundamental to technology management practice – the art of aligning people, processes and technology investments to business vision and strategy.
This management principle is important as several aspects of ICT services delivery require varying intensity in skill sets, processes and tools to drive-in the value of Technology.
Technology is now more than just a business support arm. It relies on use of measures that are essentially considered key and evolving, with business to drive value. When these key measures are turned into indicators, they are Key Performance measures or indicators (a.k.a KPIs) used to signal alignment to a plan, or one that invokes business performance in a balanced way across the “length and breadth” of the business (including every identifiable function or team that is part of the organization chart and with a value contribution to the business).
This article gives a view to actualizing value management and its delivery through technology services. This view, whilst based on experience, asserts that CSP technology delivery and management strategies can also include programs that aim at higher value performance measures even through traditional outsourcing as well as the more homed in value based outsourcing arrangement.
The article also promotes an insight into defining and pitching “Value” to business (CSP Executives) as we engage customers on the value positioning of Huawei Service-Products & Solutions.
The ICT industry has business functions intensifying their quest for more business aligned value, and as a result of this, creating an unprecedented pressure on Technology functions (IT & Network/CT) to show alignment. Offerings from Professional Services providers are usually aimed at salvaging a situation in the business lifecycle without necessarily looking in the evolution of business – the Journey.
It is therefore intended through this article, the need to help gravitate our Technology management discipline towards a continuing engaging performance re-alignment program with our customers, in order to ensure their business is our business, and our performance gives rise to their performance through real value measures.
I hope by the time you’re done reading this article, you will be able to sanitize the selection and use of operations measures and their metrics to truly identify business-aligned indicators that go to enable value to CSPs, and act as an alignment of offered services with the customers business vision and strategy at the heart of our value proposition.
WHY THE NEED FOR “REAL” KPIs?
Technology oriented teams tend to call any numeric value within a business domain a “KPI”. In most cases this doesn’t make sense and as a result Business functions have impressions that Technology divisions offer “KPI” that have no alignment to business performance. If a metric is not “key” to business improvement and excellence, or driving value in business-technology joint performance, then indeed it’s a trivial measure and not a “KPI”.
The benefits of real KPIs are that they provide executives across business and technology functions with “information”, that is “meaningful” to make better decisions. KPI’s are like decision supporting parcels aimed at informing business what is happening. As an example, “total cost to acquire a new subscriber by a particular channel” is a key performance measure for a sales team in-charge of customer acquisition via that channel, say through Seven Elevens.
This KPI:
- Helps to choose an appropriate marketing approach to acquire new subscribers and eliminate channels that are neither cost effective nor operationally efficient. Its relevance is to the various marketing and sales channels associated to customer acquisition and this enables these business teams or functions to decide possibly replacing expensive channel programs with alternately cheaper more lucrative ones.
- Can also help to define, the right level of pricing for services. Knowing the cost to acquire a new subscriber enables the CSP decide on the pricing of new services or the maximum discount that can be afforded to guarantee profitability.
- Will support better leads generation strategies. A CSP might start promoting a low-cost or free service as a front end for acquisition, making profit on the back end product by managing the measures that support this KPI with technology functions.
Performance Indicators enable the business have better control of its operations and steer correctly towards meeting its vision and strategy. Business functions will rely on information harnessed from data to enable drive the right decisions at the right time. Thus, in the wake of the growing talk in the communications industry to drive better business-IT alignment, the tons of measures or data points and technical metrics extracted to report to business must be re-aligned towards providing performance visibility to business and as well expose opportunities for technology functions to boost investment alignment (better ROI, better TCO, better RRI).
To understand business and the pressures of performance, I adopt a framework widely acknowledged to provide a sound balance of performance contribution through team interlock towards business as a whole. This framework is called the Balance Score Card, a model business performance scorecard that benchmarks activities executed by teams, departments, functions in an interlocked manner towards the vision and strategy of a business.
What is a balance Score Card?
The Balanced Score Card (BSC) is a strategy performance management tool (Exhibit 1) – a semi-standard but structured report, supported by a customizable design method and automation tools that can be used by business managers to keep track of the execution of activities aimed at delivering a certain strategic objective or vision (Abstracted from Wikipedia). It is semi-standard because every business will have performance management requirements unique to their operations and therefore the need to customize it as per each business organization. No one business performance solution formula exists, therefore it provides a fundamental performance management structure but leaves the performance criteria and entities to each business to formulate.
Exhibit 1 – The Business Performance Tool – Balance Score Card
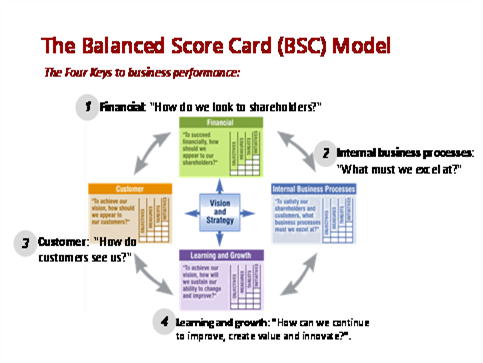
BSC is the most widely adopted performance management framework reported in the 2010 annual survey of management tools undertaken by Bain & Company. It is adopted by highly performing organizations of the fortune 500 company.
In my past executive management roles the use of BSC as a strategic tool to grow performance and keep teams aligned towards the overall strategy and objective of “our” business was common. This enabled identifying business underperformance per team/function as well as helping implement plans for improvement, as well as in rewarding over performance. This approach helped correct and move on key decisions more actively and expedite the process of achieving set goals.
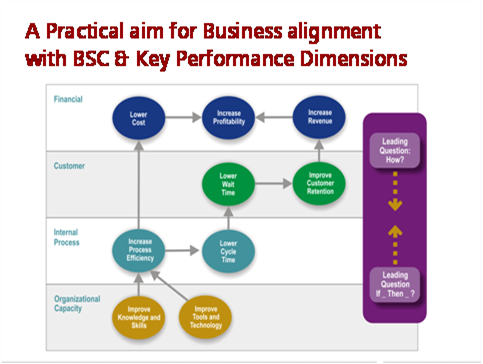
BSC relies on relevant reports, including KPIs to steer the business from four key dimensions identified as pivots to performance management. Exhibit 2 relates the four dimensions (Organizational Capacity, Internal Process, Customer and Financial) of a BSC with high level performance objectives that form a strategic plan. Once performance dimensions are clearly demarcated into the BSC, questions are developed to enable relate each team/department/functions contribution towards the strategy.
Exhibit 2 –A BSC hierarchy with performance metrics cascading towards a set objective – Profitability
KPIs AND METRICS
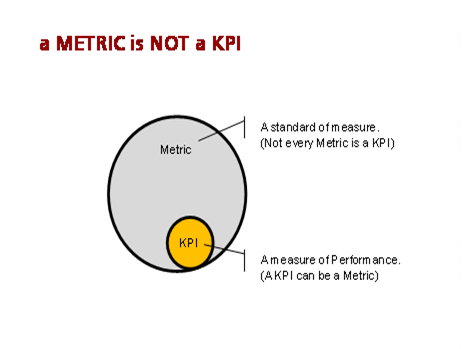
A KPI is a metric, but it every metric is not a KPI. The significance of this statement is that, a KPI if measured and improved has “investment” result that yields a positive impact on a business goal. A metric on the other hand is simply a measure with trivial or a very vague contribution to business goals. Investing in bettering metrics may not have any benefit to the business, whereas in the case of real KPIs, investing in improvements results in direct benefit to business targets achievement.
Example-1: “Total cost to acquire a subscriber” – This might be or might not be a KPI depending on the business target. If existing costs to acquire a new subscriber is high and a new way to reach the same customers was achieved but at 10 time’s lower price, then “Total cost to acquire a subscriber” is an excellent KPI that will affect business performance significantly. In this case, the assumption is that there is only one way of acquiring a subscriber, and therefore “total cost of acquisition” makes sense when applied as an input to a KPI.
Example-2: ”Average Handling time” is considered by many a CSPs as a Customer Care KPI, however, very mature and savvy Customer care and call-centers see it as only a measure. What is rather more important is the quality of the handle time with the customer. Experience suggests that performing businesses and CSPs do not view their service interactions as “cost” alone, and thus a need to shorten handle-time. Instead, they see each interaction as a valuable opportunity to engage with, learn from, and advise a customer—after favorably resolving customer problem.
Therefore, a KPI that will be valuable to the business, including Customer Care must be of higher value alignment, such as focused on “quality of resolution of customers problem”, “feedback from customer”, “stage in up-sell or cross-sell of an offer to a customer” etc.
When re-considered in this way, “Average Handling time” – AHT becomes a flat and vague measure, and as such will not be a business performance aligned KPI, or rather more potently it lacks the foundation of driving Customer Care performance.
Exmaple-3: Using a famous measure such as “Monthly website visitors”. Every online business wants to have and drive more traffic to their websites. With all things equal, the metric can easily be used as a KPI, however, all businesses don’t have the same basis and as such the measure may not qualify consistently as a KPI. The number of monthly visitors is therefore better positioned as a metric.
To go further in deriving KPI’s from such a metric in order to enable the business functions align with technology we probe further on the various channels available to understand the “Monthly website visitors”. The true business related performance indicators can include “What will be key to drive growth, financial value and indeed have an impact on the customer” , “what methods were used”, “who these new visitors were” and “where will they come from”. These questions are a mix of leading and loaded questions intended to understand and be able to plan from both business and technology dimensions.
For most online businesses, the number of monthly visitors is an excellent metric, but does not have any business score card attachment that equates to being a key performance indicator capable of influence the business. As such “Monthly website visitors” will not yield or drive business benefit whee the visitors are not paying to visit a site.
Reference Exhibit 3, relationship between Metrics and KPIs.
Exhibit 3 – A Metric & A KPI relationship
Example-4: One famous IT “KPI” is “Availability”. Availability has been measured over time and presented as an IT “KPI” but this has in many instances provided little or no confidence to business functions in the line of supporting or enabling business growth through technology alignment.
In most cases IT has computed availability as merely a measure of the uptime of a service with a vague alignment as to all the other aspects of impact to business teams.
Availability requires considering several other measures and techniques including fault tree analysis that include – reliability to end-users, resilience to outages, serviceability when needed, recoverability during outages, maintainability and security of a service delivered etc. It is more than purely considering the physical state of a service. The question of quality of “availability” can arise, and if indeed the availability at the time needed most (peak) was quality or not are equitable questions that need to go into KPI planning for availability.
Focusing on tangible metrics
Answering key business questions from the point of view of tangible metrics drives technology-business alignment, by focusing on the business. From the example of “Monthly website visitors” key questions from business functions that focus on performance will exist around dimensions like “visitors that come from search engines”, “Keywords used to search” etc.
Through this we know visitors will generate qualified leads that will be successfully converted into sales. Also, we will need to know what keywords are relevant and needed to filter types of search engines traffic. These thoughts enable IT measure more potent or key business focus that answer business questions and as well enable IT investments into the right products and operations structure in order to facilitate business performance.
It is extremely overwhelming when Outsourcing providers approach engagement contracts using similar “KPIs” delivered by internal IT functions. This approach has consistently led to a Businesses displeasure to appreciate the value of Outsourcing engagements and the added value “benefits” to the business other than just cost arbitrage.
In response to this, Outsourcing engagements have been transforming over the years with recipes that consider outcome based hybrid models to support the delivery of direct and measurable value using Business-aligned performance metrics (Exhibit4).
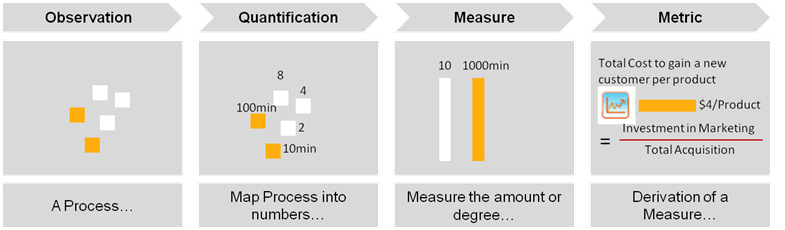
To effectively achieve more value, the need to observe and understand the business is critical to underpin the value measures intended. Understanding the business requires identifying core and non-core processes, apply a mapping of appropriate quantifiers, develop a means to objectively and transparently measure the processes in scope and defining metrics that drive performance and steer the business.
Exhibit 4 – Deriving Measures of Value
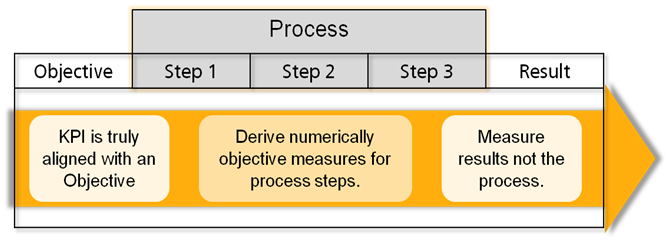
The right intention of a Process based KPI is to measure the results and not the process. Processes are developed and intended at delivering results (Exhibit 5). The business of CSPs can be divided into key process domains using the TMForum eTOM Business map. Reference to the eTOM Map, there is already an essential foundation to enable Outsourcing partners and Technology functions to leverage real business performance metrics, as a means to evaluate how well performance is through the eye of business.
Exhibit 5 – Results are Tangible not the process
The trend behind the evolution of Technology Outsourcing, also referred to as the 3rd Wave, is all about Technology partnerships to improve alignment towards outcomes. It’s a pure and simple mandate that requires rethinking the current engagement means. As profitability in delivering traditional technology services diminishes, CSPs and Technology Service Providers are all asking the same question, how do we improve profitability, how do we get and give more value, what value can be given.
From a Technology perspective applying the Gartner value offering model, TVO (Total Value of Opportunity) on technology operations, business growth is primarily contingent on how Technology impacts on growing customers & customer value; and or increasing operational efficiency – Exhibit 6.
Exhibit 6 – Towards Tangibility – Reference the Gartner “Total Value of Opportunity” model
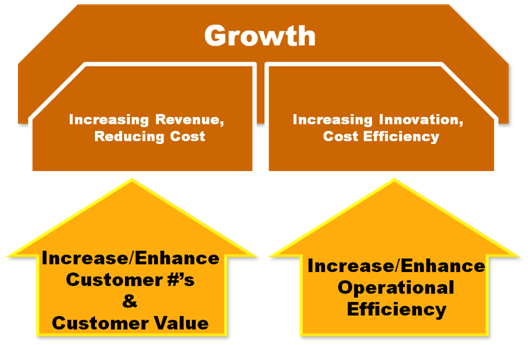
This reference model is important towards what key business processes need impacting on in order to understand tangibility of investment results with the process measure that facilitate growth of business. By turning technology attention on the outcomes and results of these processes, Technology services can be able to provide the business with key performance indicators based on valuable process measures that they support or enable in objectively quantifiable bases in order to be aligned to the business.
CONCLUSION
The business context of any KPI is formed by three key pillars; business objectives, action plans and the “teams” that are responsible to driving the results. Every well formed KPI must have a business objective, an action plan to managing it and a specific organizational unit/team it correlates to. Five Key steps towards monitoring and tracking Business-IT alignment from a Technology performance management focus are:
- To Design “Key” performance criteria based on business score cards. “Key” in KPI implies metrics that have an underpinning importance to business performance measure. Design such “keys” in tandem with business functions to underscore a basis to enable them monitor and track their performance.
- Understand the Business Objectives/results and the actions plans required. Work with business teams/functions to understand actions that correlate to improving their performance. The KPI’s are for them and not for IT. Your performance will hinge on your ability to directly add value to their business. In this regard, revert to using the Balance Score Card to create an action plan tree.
- Define true Business aligned KPIs based on processes that technology functions support. KPIs must be defined to have a clear process of delivery with action plans (for improvement). KPI’s must be designed to poses both performance monitoring views (dashboards) and performance tracking against set objectives.
- Translate KPI’s to the associated teams responsible for the processes. In monitoring and trackingKPI’s, someone or some team in business must be directly responsible to managing the performance being measured. Associating KPI’s to business teams (including functions/departments etc) is imperative to ensure true buy-in by teams.
- And Automate the monitoring and tracking of KPIs. These two activities, “monitoring” and “tracking” should be done in a manner that promotes transparency, consistency, accuracy and trust to teams. They must avoid subjectivity and promote objectivity in a way that third parties scrutiny will yield no discrepancy.
The continued cry by CSPs Business functions for better IT alignment is not a far cry. It signals a need to focus on more value delivery through technology engagement with business. It is an opportunity for Outsourcing services providers to bring value to CSPs when a more business centric view is taken to Technology management using well formed performance measures.
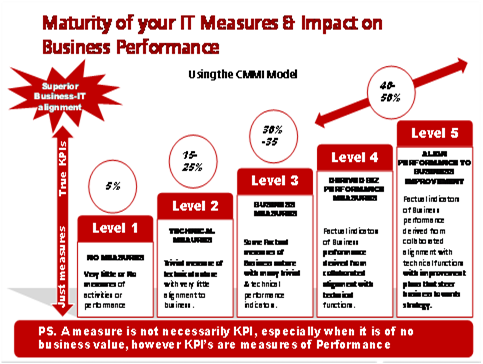
The maturity of KPIs being measured has to improve. Only 40-50% CSPs are considered using real business KPI’s as the bedrock to technology performance. Examples like Airtel India, AT&T, Verizon, NTT, etc, area already clear indicators of how these CSPs continue to drive performance from technology into business and vice-versa. The remaining 50-60% are continue to have their technology functions struggling around a mix of low level technical and business-related measures with very limited impact on actual business scorecards. Exhibit 7 depicts a CSP business survey result that shows the maturity of technology functions to drive real business performance. It is clear from the depiction that there is a huge room to drive business value to CSPs, especially Tier 2 – Tier 4 by understanding what truly is a KPI and how KPI’s must drive business results through technology performance.
Exhibit 7 – An adapted IT KPI Maturity model